The 2021 Park Experience Index: An Evolving Cost Management Tool
A theme park development has a much higher chance of successful completion on time and within budget when the developer, designers, and other team members are aligned on the expectations of the type of project they are delivering from the outset. At nFusion, we’ve established the Park Experience Index, a cost management tool to help […]

A theme park development has a much higher chance of successful completion on time and within budget when the developer, designers, and other team members are aligned on the expectations of the type of project they are delivering from the outset.
At nFusion, we’ve established the Park Experience Index, a cost management tool to help establish a project’s warranted investment by looking at the type of park, or its economic model.
We’ve developed this tool through maintaining a comprehensive database of project costs, expressed in US dollars, which is annually aligned for inflation. This year, we’ve also assessed and considered pandemic-induced changes.
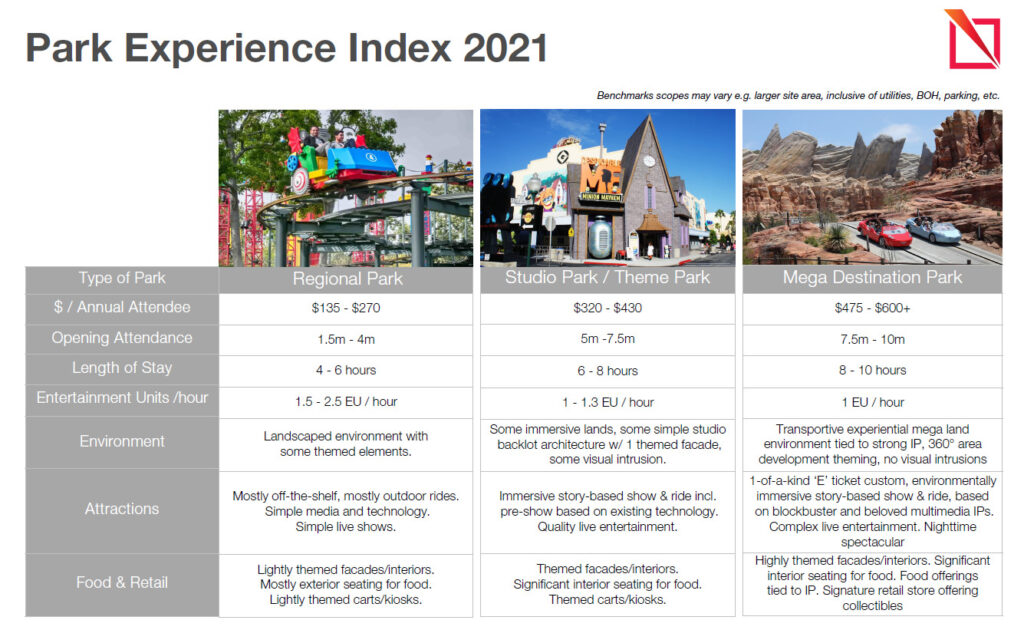
The 2021 Park Experience Index cost management tool includes three categories: Regional Park, Studio Park / Theme Park, and Mega Destination Park.
Previously, we had four categories of parks. Based on the industry’s current trends and trajectory, we’ve merged ‘Iron Ride Parks’ – which feature high-energy coasters and outdoor round rides, basic food and beverage, minimal retail, and simple landscaping – with the Regional Park category.
Below is an overview of the three categories and corresponding cost estimates. Please note that the cost/attendee ranges are indicative only, and costs may vary significantly due to location and seasonality.
Regional Park
- Cost ranges from $135-270 per guest
- Attendance of 1.5-4 million anticipated in first year
- 1.5-2.5 Entertainment Units per hour
- Average stays of 4-6 hours
- Project duration is typically 4 years
These parks will feature primarily off-the-shelf and outdoor rides, and simple media, technology, and live shows.
We often see lightly themed façades and interiors, mostly exterior seating for food, and lightly themed food, beverage, and retail carts/kiosks.
An example of a Regional Park that opened recently is LEGOLAND New York Resort.
Studio Park / Theme Park
- Cost ranges from $320-430 per guest
- Attendance of 5-7.5 million anticipated in first year
- 1-1.3 Entertainment Units per hour
- Average stays of 6-8 hours Project duration is typically 5 years
These will typically have immersive lands created with simple studio backlot architecture, including one themed façade and some visual intrusion. There will be immersive story-based shows and rides, including pre-shows, based on existing technology, and quality live entertainment.
Façades and interiors will be themed, there will be significant interior seating for food. There will also be themed carts and kiosks.
An example of a Theme Park currently under development is Six Flags Qiddiya. Another that is scheduled to open December 2021 is Genting SkyWorlds in Malaysia.
Mega Destination Park
- Cost per attendee ranges from $475-600+ per guest
- Attendance of 7.5-10 million anticipated in first year
- 1 Entertainment Units per hour
- Average stays of 8-10 hours
- Project duration is typically 6+ years
These feature transportive experiential mega lands tied to a strong IP or IPs, with 360-degree area development theming and no visual intrusions.
Parks will have one-of-a-kind E-ticket customs, environmentally immersive story-based shows and ride based on blockbuster and beloved multimedia IPs, complex live entertainment, and typically feature some kind of nighttime spectacular.
Façades and interiors will be highly themed and there will be significant interior seating for dining. Food offerings will be tied to the IP(s) and signature retail stores will offer collectables.
An example of a Mega Destination Park is the Universal Beijing Resort, which opened recently.
Key emerging trends in the theme park industry that could impact cost management considerations going forward include:
- Mega Destination Parks will manage capacity by using pricing models to replace the “mass-market” access.
- Increased pricing will requires focusing on more personalization (e.g., wearable technology featuring individualized services and offers), and more immersive experiences.
- Regional Parks are adopting dynamic pricing to offset the losses during the pandemic.
- More virtual reality and augmented reality in guest experiences.
- More touchless technology including ticketing through on-line reservations, security, pre-ordered food service, retinal scanning / facial recognition for employees, enhanced RFID-equipped wristbands or mobile apps to pre-book rides, pre-order meals, track attraction waiting times, etc.
- Focus on environmental impact and sustainability.
- Enhanced quality of food, including more vegan choices, organic and nutritious food, and increase the guests’ immersive experience by basing menus on the IP (intellectual property).
- Centralized kitchens serving various food & beverage venues.
- Operators will adopt enhanced touchless screening systems like Evolv Technology.
The percentage increase of show and ride scope of Regional Parks are expected to be higher than Studio and Mega Parks, as the latter typically include VR, AR, and immersive experiences, whereas Regional Parks now typically lack these. As Mega Destination Parks like Disney continue to set new standards, advancing technology is expected at all levels.
Due to the impacts of the pandemic, pre-operational cost of Regional Parks will proportionally increase more when compared to Theme Parks and Mega Destination Parks. The overall average increase in capex compared to 2020 is expected to be between 6% and 8%.
Because of the COVID-induced slow-down in the themed entertainment industry, we’ve also seen soft costs (project management, professional, and design fees) become very competitive. That said, the demand for increased subject matter experts (SMEs) in areas like sustainability and technology may offset the expected savings.
The current shortage of construction materials, ongoing increase of key construction material prices (e.g., steel, copper, and wood), skyrocketing shipping costs, huge demand for equipment, schedule delays, and talk of inflation in United States, have resulted in a very volatile market, which impact current construction projects substantially.
However, it is important to note that as the global economy recovers after the pandemic, the volatility will reduce. Therefore, the Park Experience Index should be used as a longer-term cost management tool, rather than a prediction of investment in the next six months.
For more personalized guidance surrounding your current project or vision, get in touch with nFusion today.


About the Author
Martin Zurauskas
Managing Director
Martin is the Managing Director for nFusion, where he leads the project management services group with vision and focus into new markets and is responsible for its global efforts. With over 30 years of experience, Martin provides leadership to nFusion’s entertainment and leisure destination project teams, implementing innovative project delivery solutions with the ‘big picture’ in mind, and his finger on the pulse of each project. Full Bio.