Where Does Your Development Fall on the Park Experience Index – And Why Does It Matter?
Creating a successful theme park requires viewing the project through the lens of three influential cost categories. The first is the Park Experience Index.
In an earlier Insights article, we began to explore the reasons why theme park development costs so much – and what developers can do to deliver and operate a more cost-effective product.
We explained that the increasing use of technology in theme park attractions – which guests truly desire – has dramatically driven up capital and development costs.
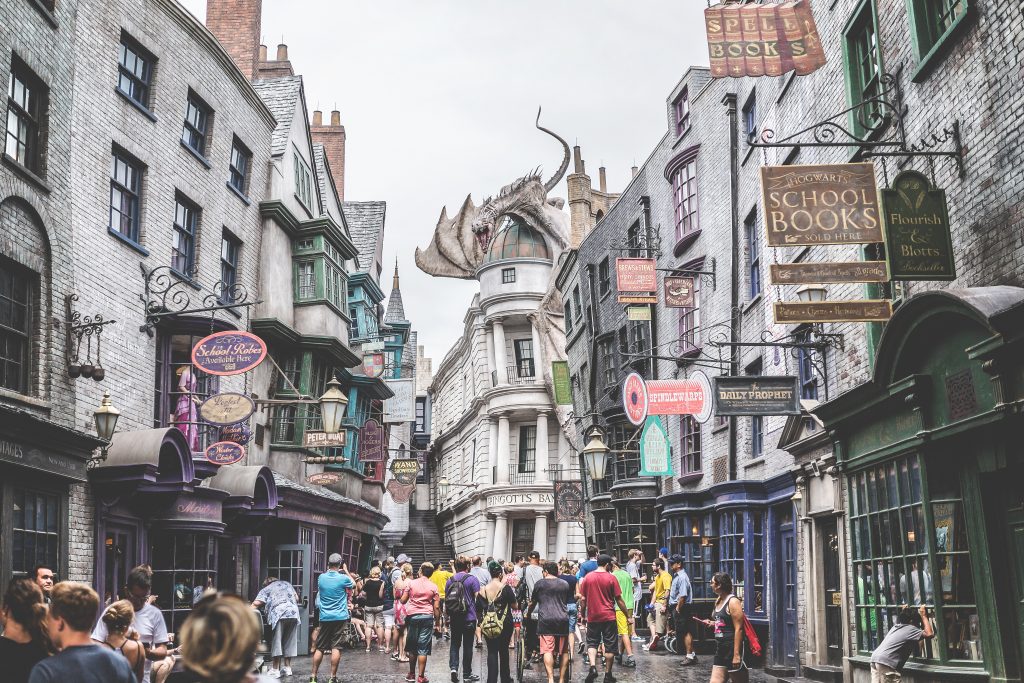
In addition, park guests have certain expectations of their experience that drive up costs. These expectations include immersive story-telling throughout the park’s environment, in ride queues, within attractions, with interactive experiences, in personalized itineraries (apps, fast passes, and VIP perks), and in hotels connected to the park.
They also expect the park to operate 365 days a year instead of seasonally, with no down time for maintenance; a high comfort level that includes enclosed spaces, covered areas, and air conditioning; and food offerings that go beyond the burger, necessitating an increase in kitchen size and complexity.
For parks in high-tourism regions, these costs can be offset by increases in ticket prices and other areas where guests spend within the park, including food and beverage, souvenirs, and gaming.
In parks with a more regionally driven consumer base, we determined that creating a successful theme park requires viewing the project through the lens of three influential cost categories:
- Understanding where a project falls on the Park Experience Index
- Looking at all the variables of Park Programming
- Presenting a strategic Creative Mix

In this article, we will seek to define the first category and answer the question: What is the Park Experience Index?
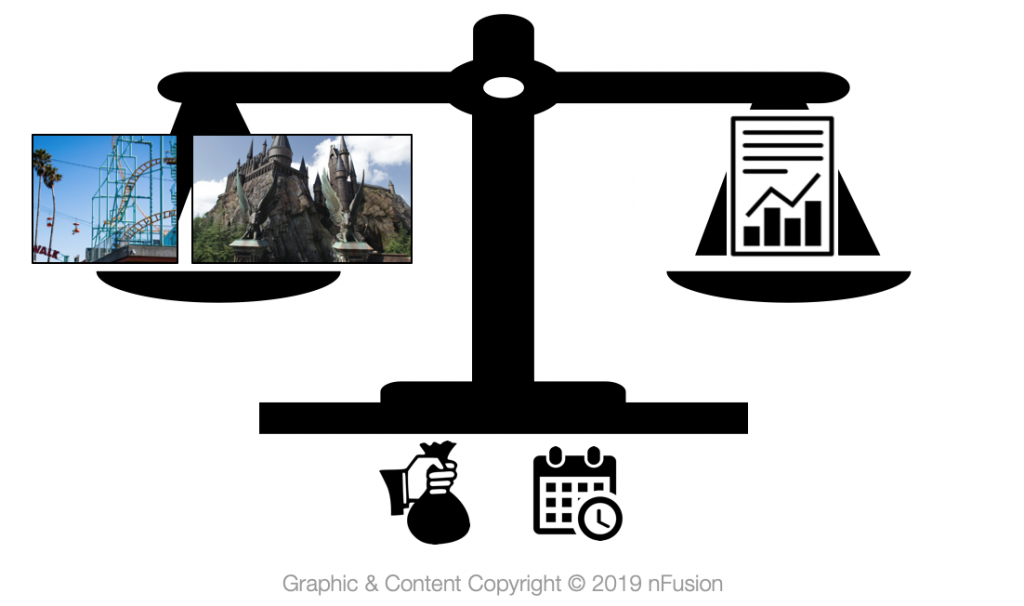
In essence, the Park Experience Index is a metric which informs us on the value guests derive from a park, measured against the developer’s cost per attendee annually to deliver the experience.
The various types of park – Super Theme Parks, Theme Parks, Studio Parks, Iron Ride Parks, Regional Parks, and Amusement Parks – offer different experiences, and the annual costs per attendee to deliver those experiences varies with each type of park. (See Index below. Note: The terms used to describe each type of park in the Index simply provide a system of measuring the cost and may not match other definitions of those destinations.)
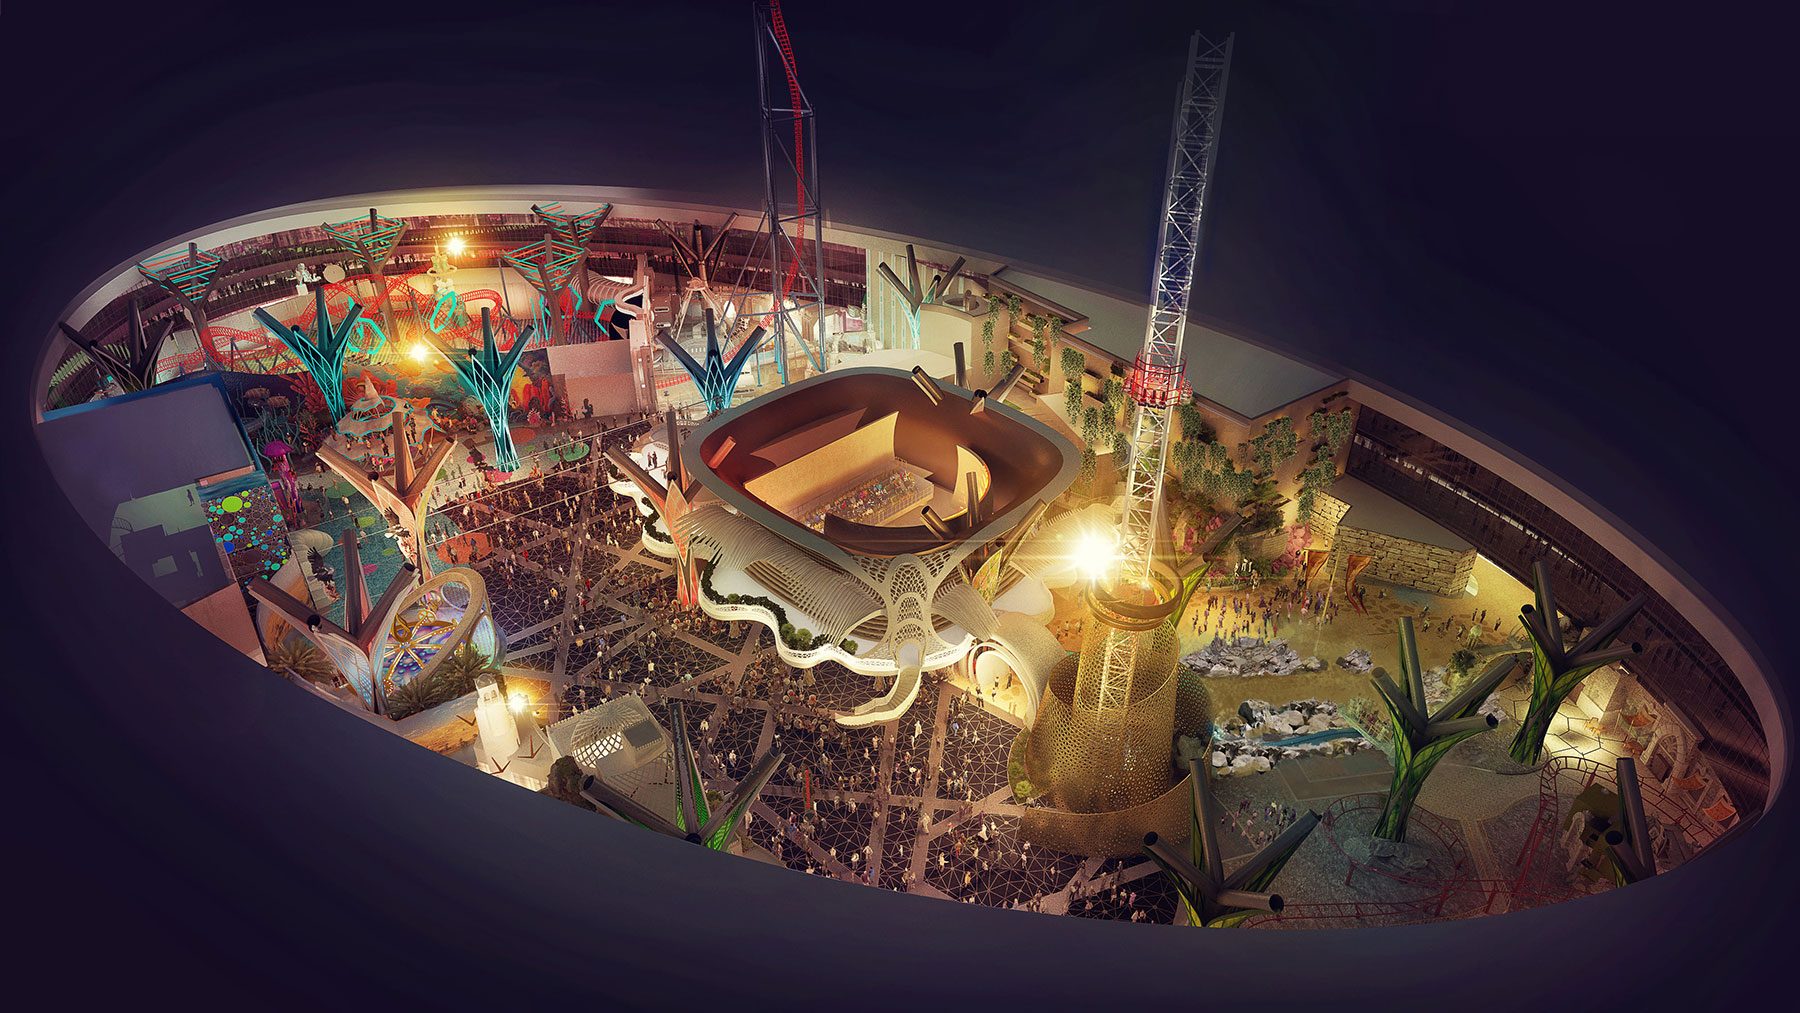
A Super Theme Park is a large, permanent area for public entertainment, with amusements, rides, food, and other attractions – all connected by a single subject. It incorporates highly technical, extremely immersive environments, from the rides and attractions to the retail and dining, with food items that pair well with each experience. Super Theme Parks features immersive rides and shows (or entertainment) based on the stories within that theme.
A Theme Park is similar to a Super Theme Park in that rides and attractions, retail, and dining are based on stories within a particular theme; however, Theme Parks provide an immersive environment utilizing less technical methods than Super Theme Parks do.
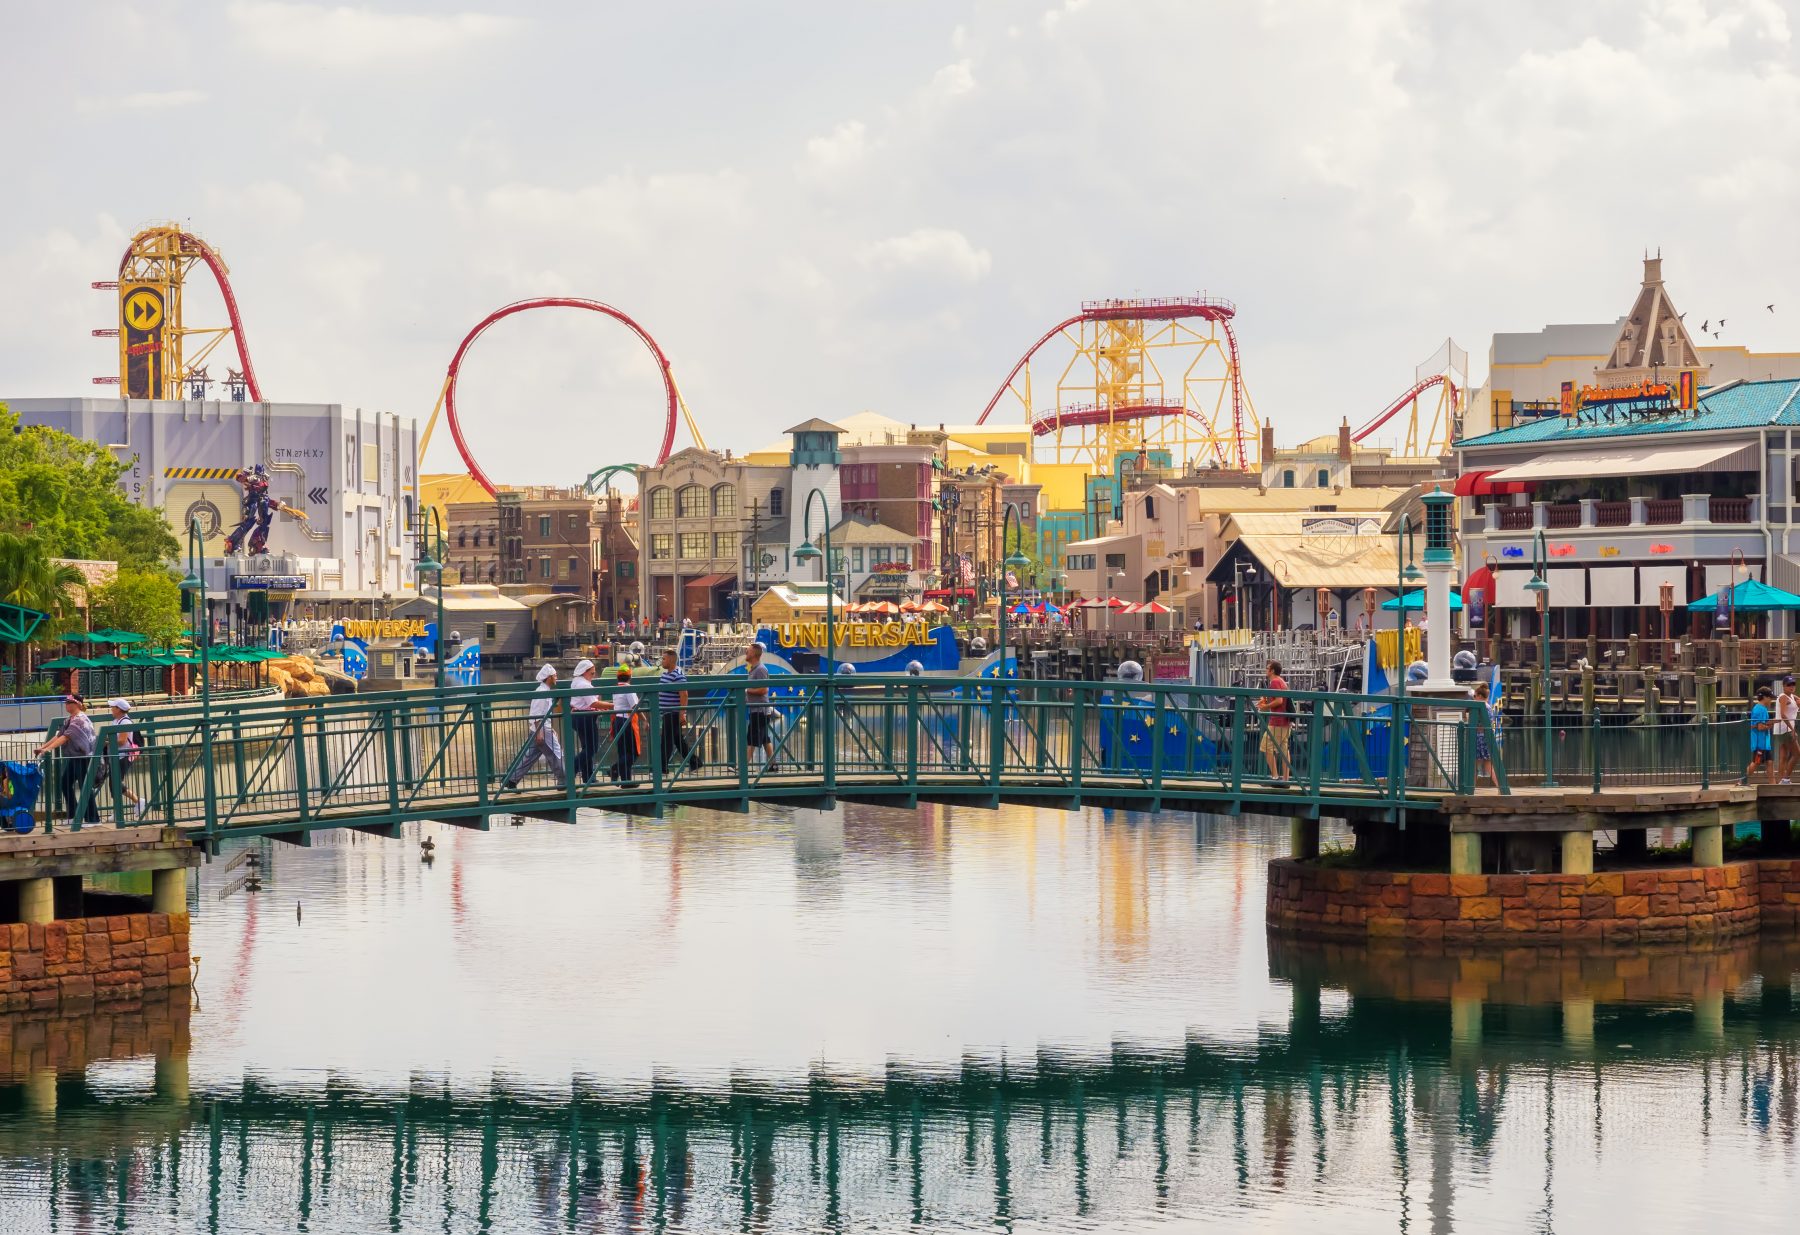
Both Super Theme Parks and Theme Parks feature themed restaurant and retail buildings with mostly interior seating, exit and specialty shops, and guest services that include lockers, changing rooms, specialty amenities, shaded areas, and secure parking.
But the cost per annual attendee to develop, design, and build a Theme Park experience ranges from $325 to $425, while the annual cost per attendee to deliver a Super Theme Park experience ranges from $450 to $550 – a significant difference due to the high use of technology in Super Theme Parks.
A Studio Park features the characters and stories owned by a particular entertainment studio. Its attractions include live simulated studio events and simple studio architecture, exit and specialty retail shops, studio-themed eateries comprising simple buildings with mostly interior seating, and guest services that include lockers, changing rooms, specialty amenities, shaded areas, and secure parking. The cost per annual attendee to deliver this experience ranges from $200 to $300.
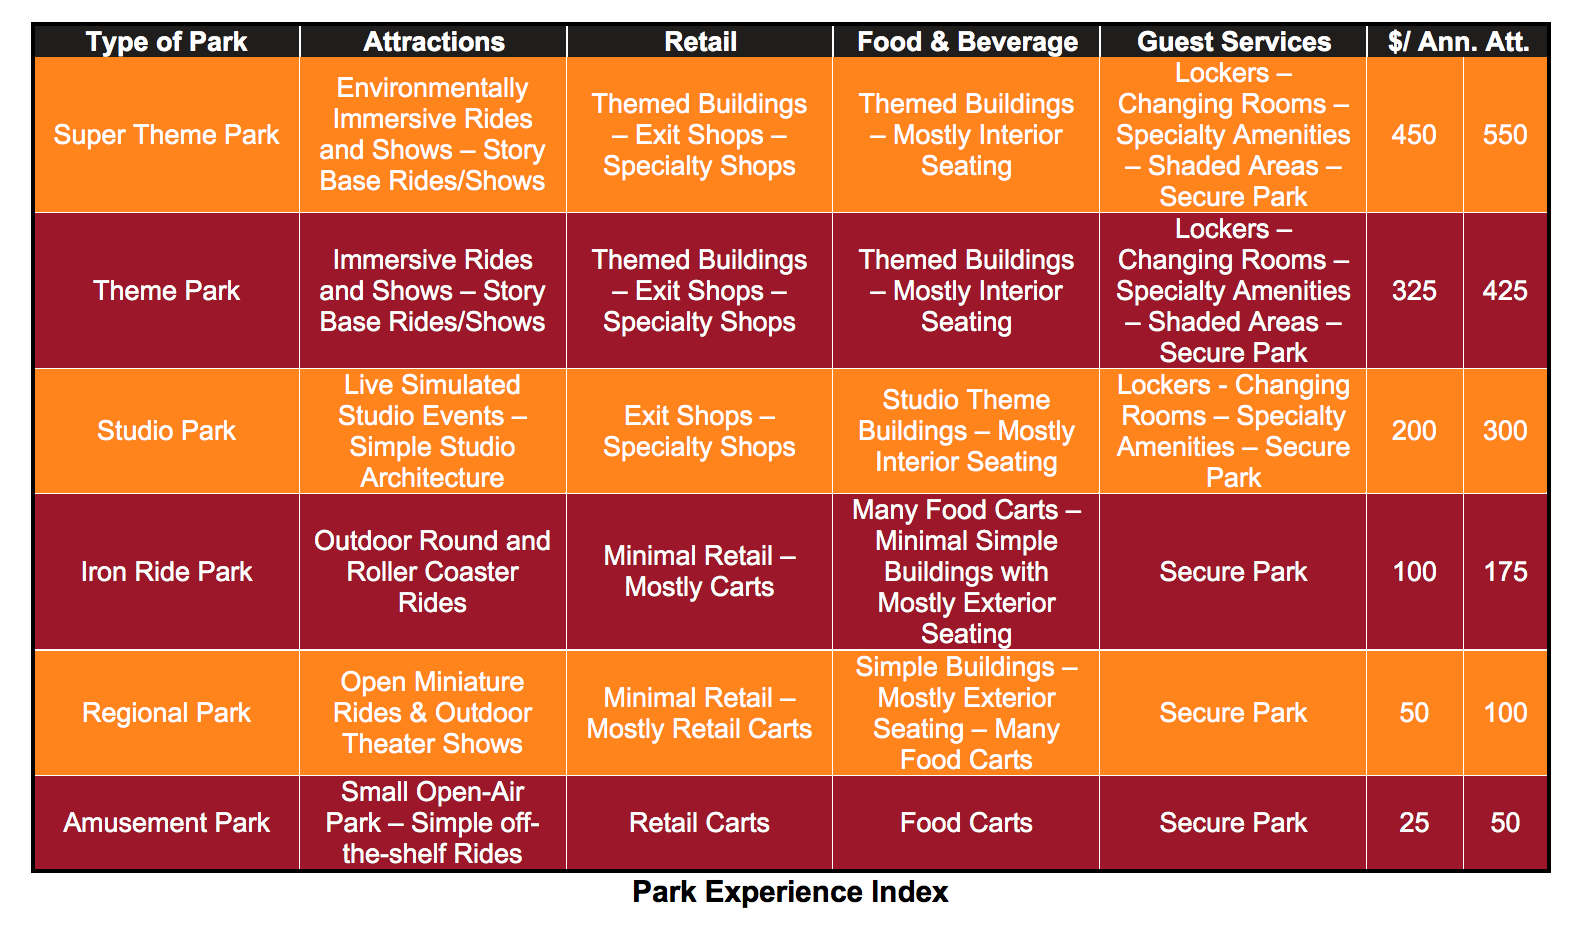
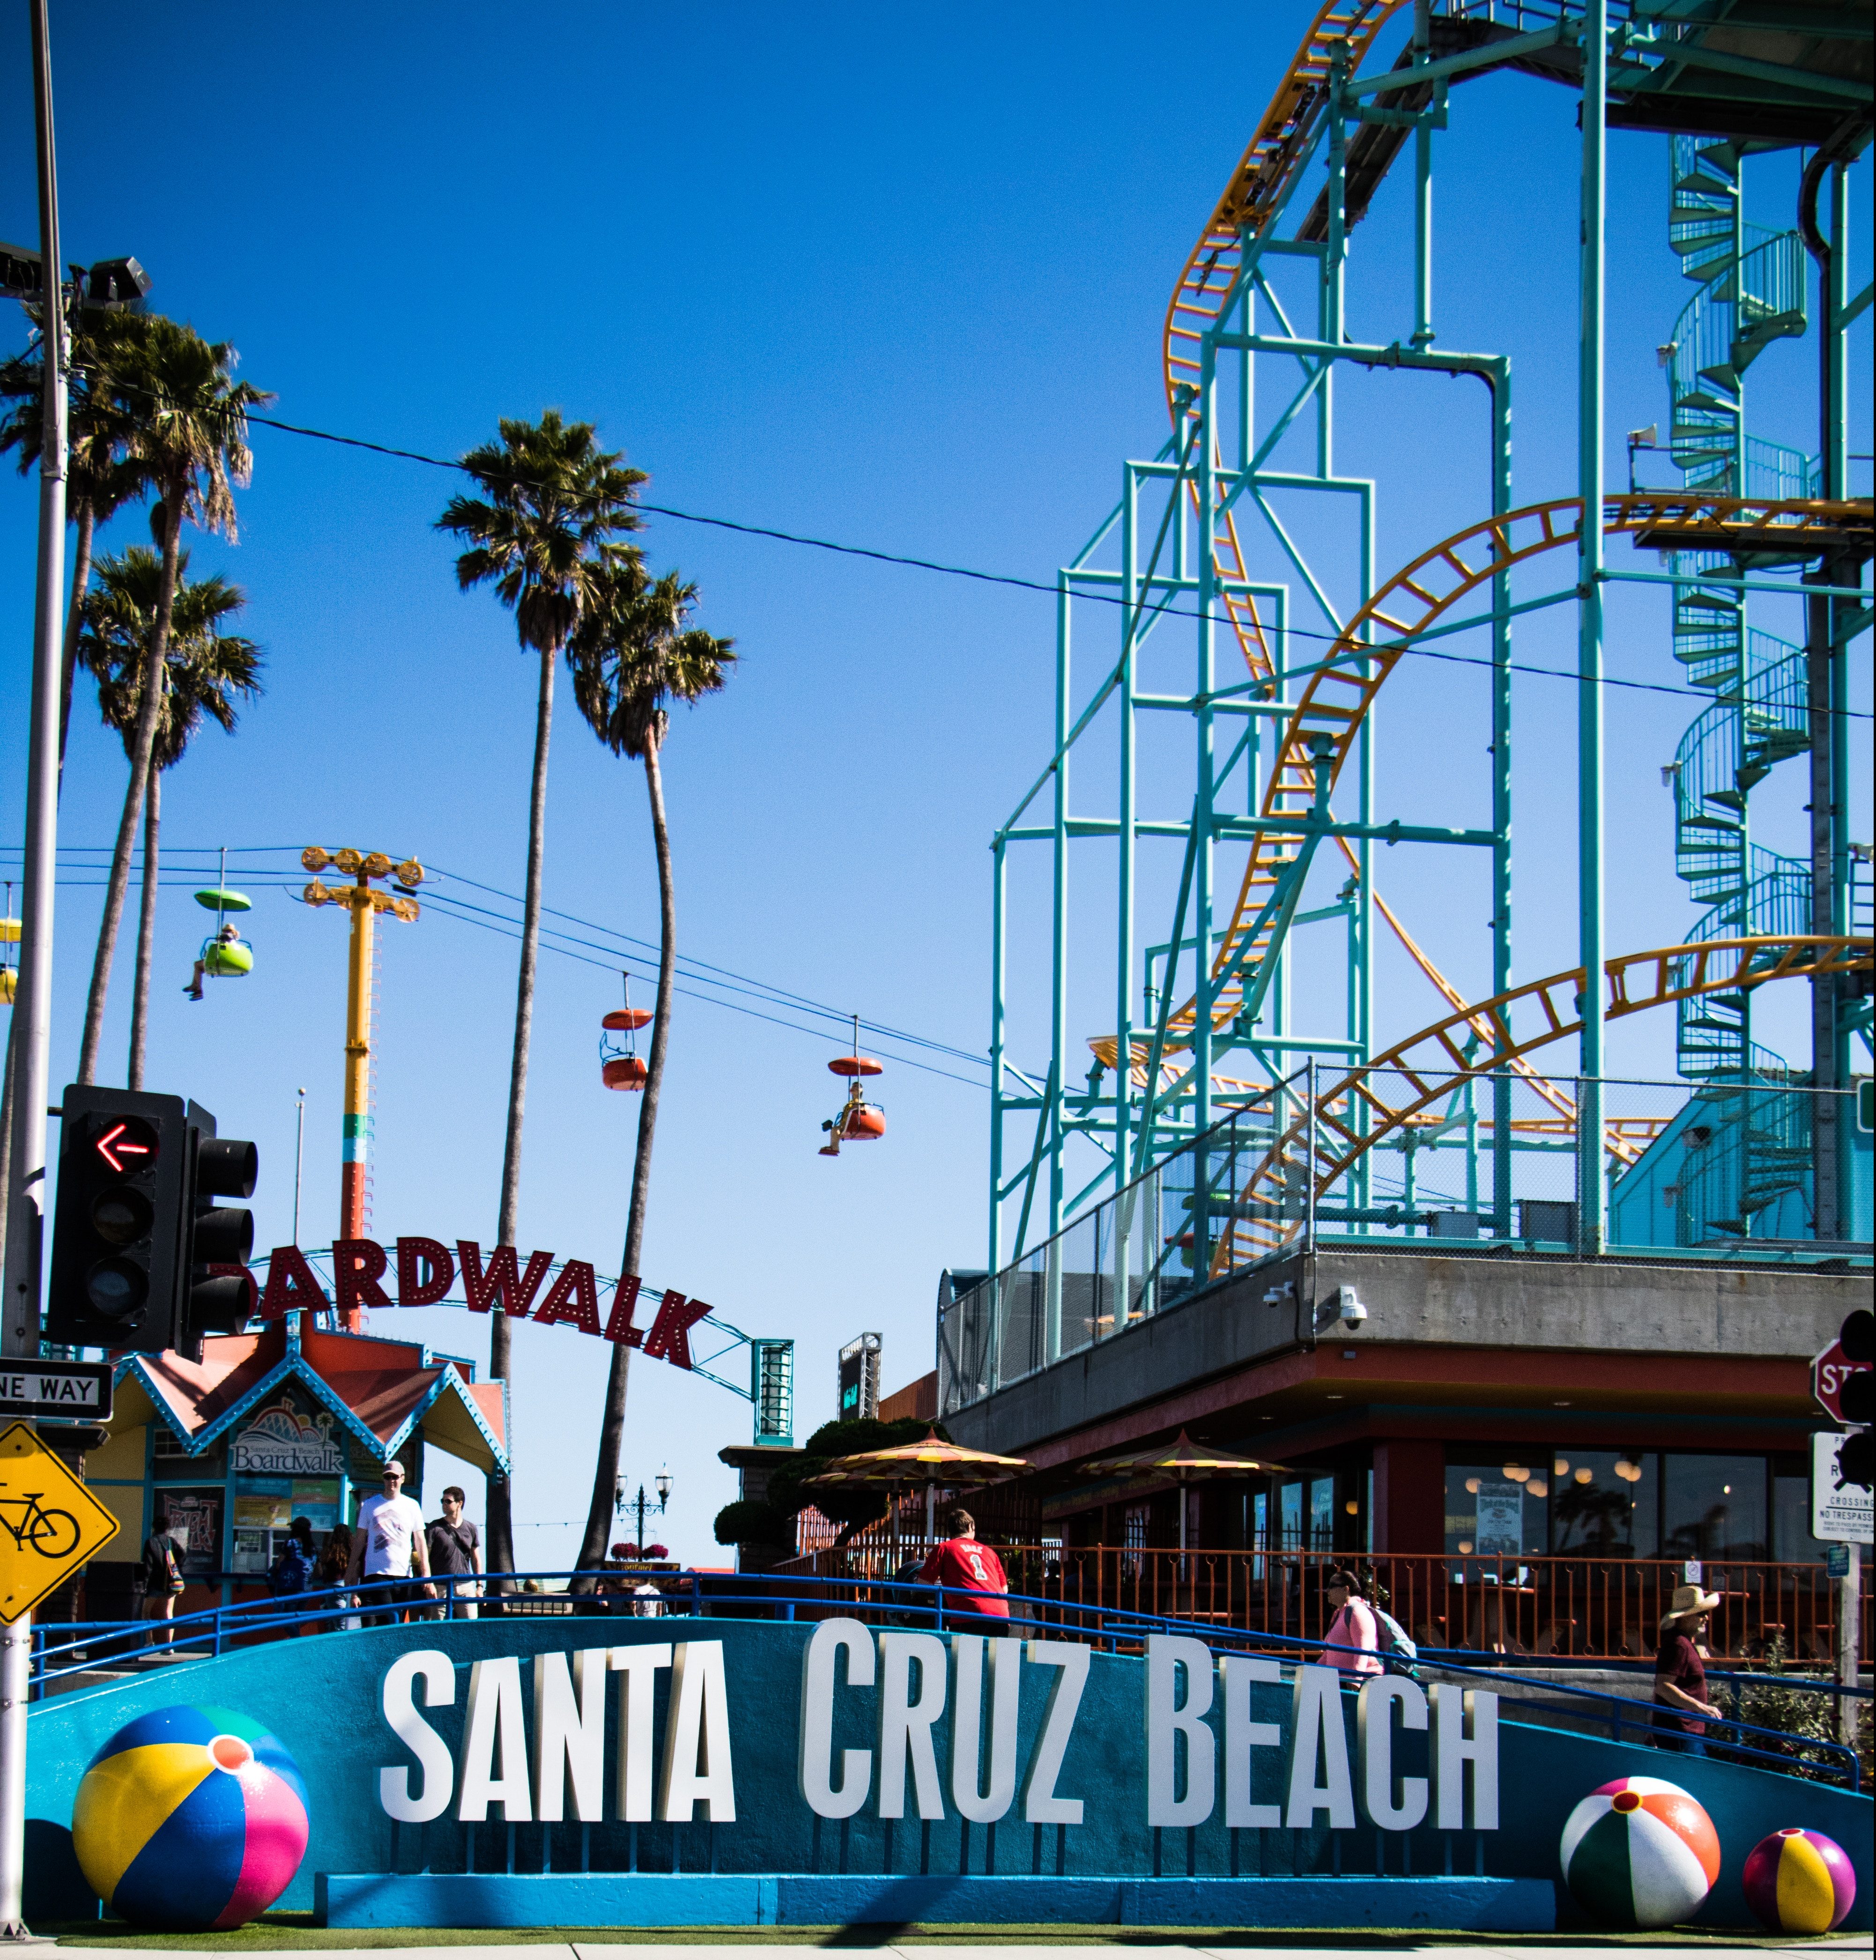
An Iron Ride Park offers outdoor round and roller-coaster rides, minimal retail (mostly carts), and possibly rides, games, and food stands all built near each other within a defined area. Eateries consist of minimal simple buildings with mostly exterior seating, food carts are in abundance, and secure parking is offered. Cost per annual attendee to deliver this experience is $100 to $175.
A Regional Park’s attractions include open miniature rides and outdoor theater shows. The minimal retail is mostly carts, and dining options include many food carts and simple buildings with mostly exterior seating. Secure parking is a guest service. Cost per annual attendee to deliver this experience is $50 to $100.
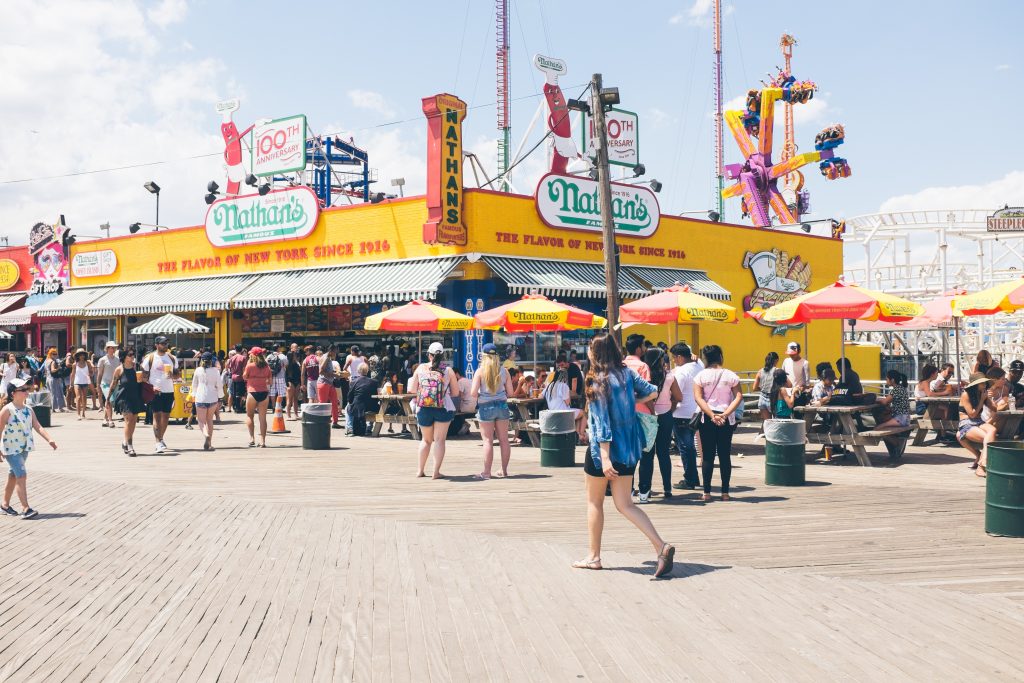
An Amusement Park is less theme oriented and more activity oriented. It consists of a small, open-air park offering simple, off-the-shelf rides. Retail and food options consist of carts only, and secure parking is a guest service. Cost per annual attendee to deliver this experience is $25 to $50.
The Index indicates that the cost to deliver these different experiences rises with the experience level, and how an increased use of technology in particular increases the cost per annual attendee.
From development kick-off, a theme park project benefits from all stakeholders having a clear understanding of where a project falls on the Index.
The type of park – or its economic model – which is defined by the type of attractions, food and beverage, guest services, and retail components, will be determined by the business plan. The market demographics frame the level of attendance expected at the park. Combining the economic model with the market demographics yields the expected level of the Park Experience.
This is important because developing the right type of park, or mixture of park types, will substantially influence the capital development cost per annual attendee. In other words – the type of park is set by the economic model, which then sets the warranted level of investment.
Understanding the market and warranted investment is critical to determining a project’s budget from the start. The objective of the Park Experience Index is to frame the costs so that the developer, designers and all team members are aligned on the expectations of the type of project being developed.
When determining the warranted investment, it is critical to keep in mind that while the straightforward costs of the actual development and continued operation of the park makes up the bulk of the investment, the site will come with costs and constraints as well, even before ground is broken.
Costs associated with site preparations of clearing, soil remediation, utility connections, and transportation infrastructure, among other items, need to be considered when determining the investment.
Further, there are many other indirect financial impacts that will likely need to be addressed through the lifecycle of the project.
The economic model’s warranted investment is allocated to the framework of cost, and these allocations begin the process of creating target budget numbers for the scope of development.
Therefore, it is critical that stakeholders have information that is as accurate as possible for determining the warranted investment, so that target budget numbers are more accurate as well.
In addition to the warranted investment, the economic model will also address the park’s economic uplift to the region and who will gain from the park’s development.
For instance, seeking contribution from those who will benefit from the development can help move project costs into the category of in-kind contributions, thereby offsetting some of the costs.
Potential contributions could include such items as utility providers supplying services to the site at required pressure and voltage, local government providing safety and security response teams, and transportation infrastructure in the nature of roads, rail, buses, and other methods of transportation. Third-party developments and operations of non-core business lines could contribute to offset investment costs.
Once the target budget numbers have been framed for the development scope and the in-kind contributions deducted, developers have a budget for the park.
Stakeholders can determine the investment per attendee by dividing the warranted investment by projected annual attendance, and this figure places the development on the Park Experience Index, rendering it a valuable framing tool for the level of Park content.
Once the budget is calculated and framed to the scope, the team can be cast. And, once the assembled team is given clear parameters for the development of the vision that fits the Park Experience Index model, the creative process can be kicked off.
In future articles, we will discuss the components involved in the remaining cost categories: Park Programming and Creative Mix.
- Rising Cost Chart photo by rawpixel on Unsplash
- Diagon Alley photo by Troy Jarrell on Unsplash
- Nighttime Photo by Hugo Coulbouee on Unsplash
- Nathan’s Hot Dogs Photo by Thomas Loizeau on Unsplash
- Santa Cruz Photo by Brady Frieden on Unsplash
- Planning photo by rawpixel on Unsplash

About the Author
nFusion
nFusion is the only independent program management firm specializing exclusively in delivering cultural and entertainment destinations. nFusion manages projects through four major gateways to answer the most important questions: Is your vision feasible? Is your concept deliverable? Is your design buildable? Is your project operable? nFusion is one of the Companies of Nassal and is located in Los Angeles and Orlando.