The 2020 Park Experience Index: A Guide to this Essential Cost Management Tool
From the earliest stages of planning, a park development benefits from all stakeholders having a clear understanding of where a project falls on what we call the Park Experience Index. This cost management tool looks at the type of park – or its economic model – to help determine the project’s warranted investment. This economic model is defined by […]

From the earliest stages of planning, a park development benefits from all stakeholders having a clear understanding of where a project falls on what we call the Park Experience Index. This cost management tool looks at the type of park – or its economic model – to help determine the project’s warranted investment.

This economic model is defined by the attractions, food and beverage, guest services, and retail components of a park, as well as the overall level of theming and immersion, which is determined by the business plan.
Understanding how a park will serve the market is critical to deciding on a project’s budget from the start. The objective of the Park Experience Index is to frame the costs so that the developer, designers, and all team members are aligned on the expectations of the type of project being developed.
The economic model’s warranted investment is allocated to the framework of cost, and these allocations begin the process of creating target budget numbers for the scope of development.
Therefore, it is critical that stakeholders have information that is as accurate and up to date as possible, so that target budget numbers are accurate as well.
At nFusion, we maintain a comprehensive database of projects and costs, expressed in dollars and aligned for inflation. This information helps us better define the Index as a cost management tool and update definitions, parameters, and figures accordingly.

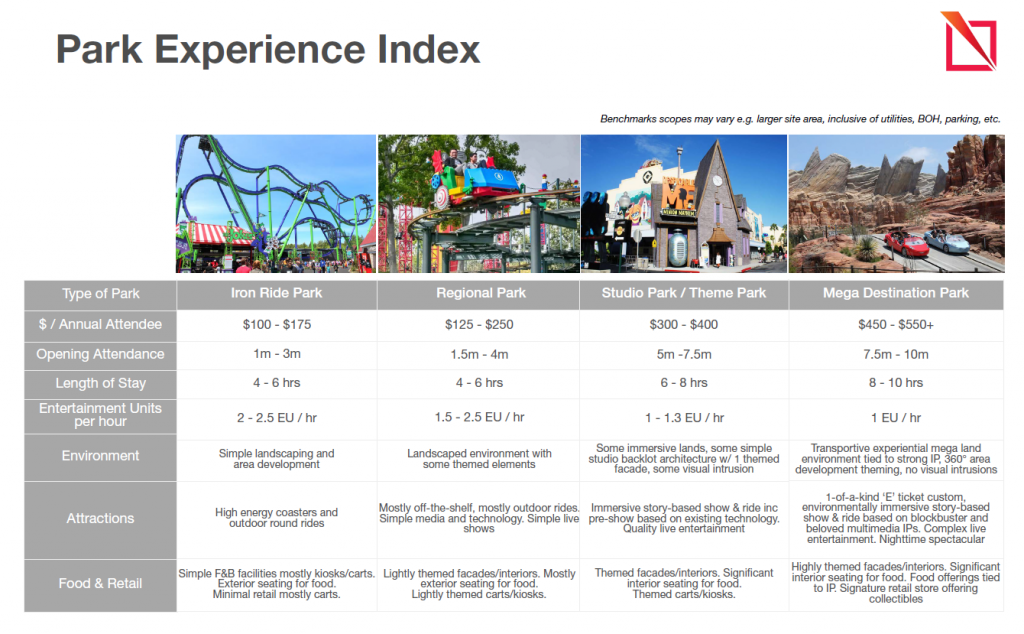
Based on this, below is a breakdown of the Park Experience Index we have developed for 2020:
Iron Ride Park
- Cost ranges from $100-175 per guest
- Attendance of 1 million to 3 million anticipated in first year
- 2-2.5 attractions experienced, or entertainment units (EU), per hour.
- Average stays of 4-6 hours
- Project duration is typically three years
These parks will feature simple landscaping and area development and attractions typically include high-energy coasters and outdoor round rides. There will be basic food and beverage facilities, mostly kiosks and/or carts, and exterior seating for food. Retail will be minimal and also mostly carts.
It is important to note that the figures above assume no theming. For instance, examples of Iron Ride Parks currently in development are the Six Flags projects in China. That said, these projects are highly themed and thus come with a much higher cost per guest – within the range of $210-$280 – than one would expect in a traditional Iron Ride Park.
Regional Park
- Cost ranges from $125-250 per guest
- Attendance of 1.5- 4 million anticipated in first year
- 1.5-2.5 EU per hour
- Average stays of 4-6 hours
- Project duration is typically 4 years
These parks will feature primarily off-the-shelf and outdoor rides, and simple media, technology, and live shows. We often see lightly themed façades and interiors, mostly exterior seating for food, and lightly themed food, beverage, and retail carts/kiosks.
An example of a Regional Park currently in development is the LEGOLAND New York Resort.
Studio Park / Theme Park
- Cost ranges from $300-400 per guest
- Attendance of 5-7.5 million anticipated in first year
- 1-1.3 EU per hour
- Average stays of 6-8 hours
- Project duration is typically 5 years
These will typically have immersive lands created with simple studio backlot architecture, including one themed façade and some visual intrusion. There will be immersive story-based shows and rides, including pre-shows, based on existing technology, and quality live entertainment.
Façades and interiors will be themed, there will be significant interior seating for food, and themed carts and kiosks.
An example of a Theme Park currently under development is Six Flags Qiddiya. Another that is scheduled to open in the late 2021 is Genting SkyWorlds in Malaysia.
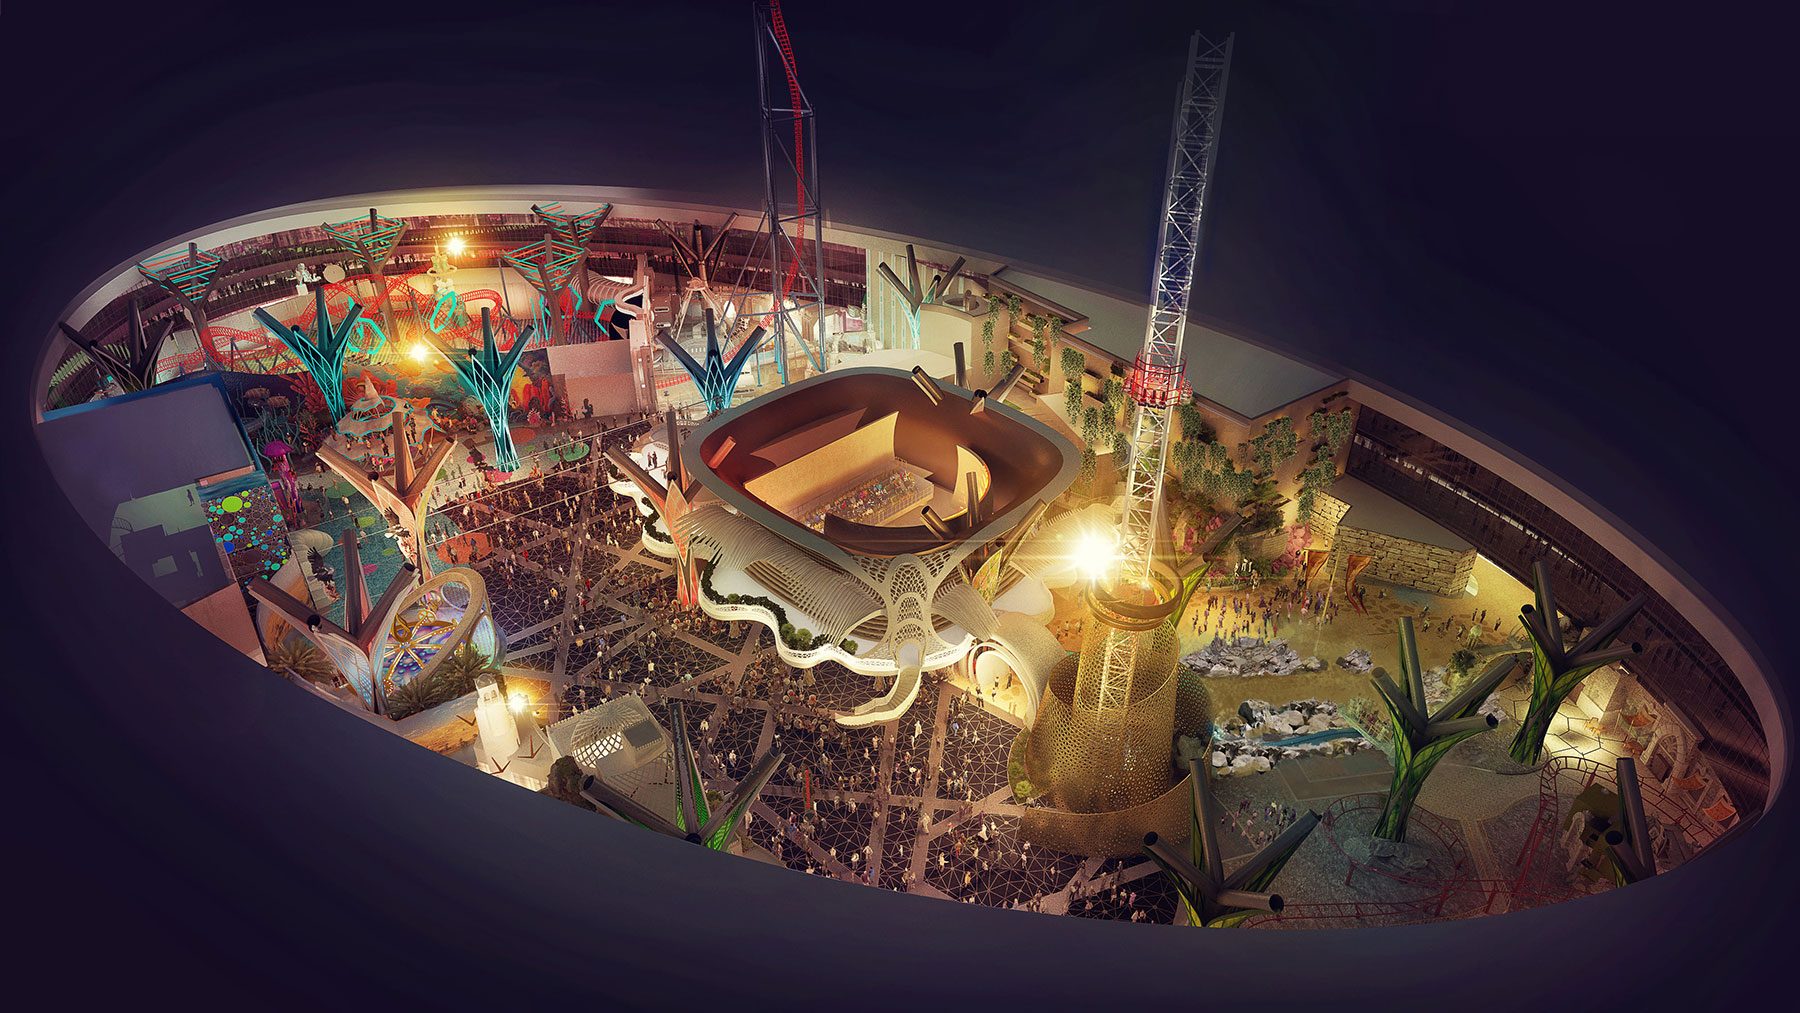
Mega Destination Park
- Cost per attendee ranges from $450-550+ per guest
- Attendance of 7.5-10 million anticipated in first year
- 1 EU per hour
- Average stays of 8-10 hours
- Project duration is typically 6+ years
These feature transportive experiential mega lands will be tied to a strong IP or IPs, with be 360-degree area development theming and no visual intrusions.
Parks will have one-of-a-kind E-ticket customs, environmentally immersive story-based shows and ride, based on blockbuster and beloved multimedia IPs, complex live entertainment, and typically feature some kind of nighttime spectacular.
Façades and interiors will be highly themed, there will be significant interior seating for dining. Food offerings will be tied to the IP(s) and signature retail stores offer collectables.
An example of a Mega Destination Park currently in development is the Universal Beijing Resort.
It is important to note that there are many trends and other factors that will impact costs, and determine whether parks under the same category are on the low or high end of the cost spectrum.
This becomes increasingly evident as we breakdown all the components of the six main Divisions of Work (DOW):
Location: Site selection process, broker costs, feasibility, business planning, due diligence, blue sky design, entitlements, etc.
Design and Professional Fees: Project management (including cost and construction management), attraction design, A&E, art direction.
Hard Costs: The cost of physical construction facility, show, ride, FF&E, and systems, including associated burdens for general conditions, overhead and profit, bonds, and permits.
Pre-Operations: Staff and expenses, pre-opening consultants, marketing, operating supplies and equipment.
Corporate: Staff and associated expenses, pre-opening license fees, legal, AP/AR, finance, interest, taxes, lease fees, working capital.
Contingency: Contingency for risk associated with design development, soft costs, construction contingency, and owner’s discretionary contingency.
Within each DOW, there are several variables that impact cost.
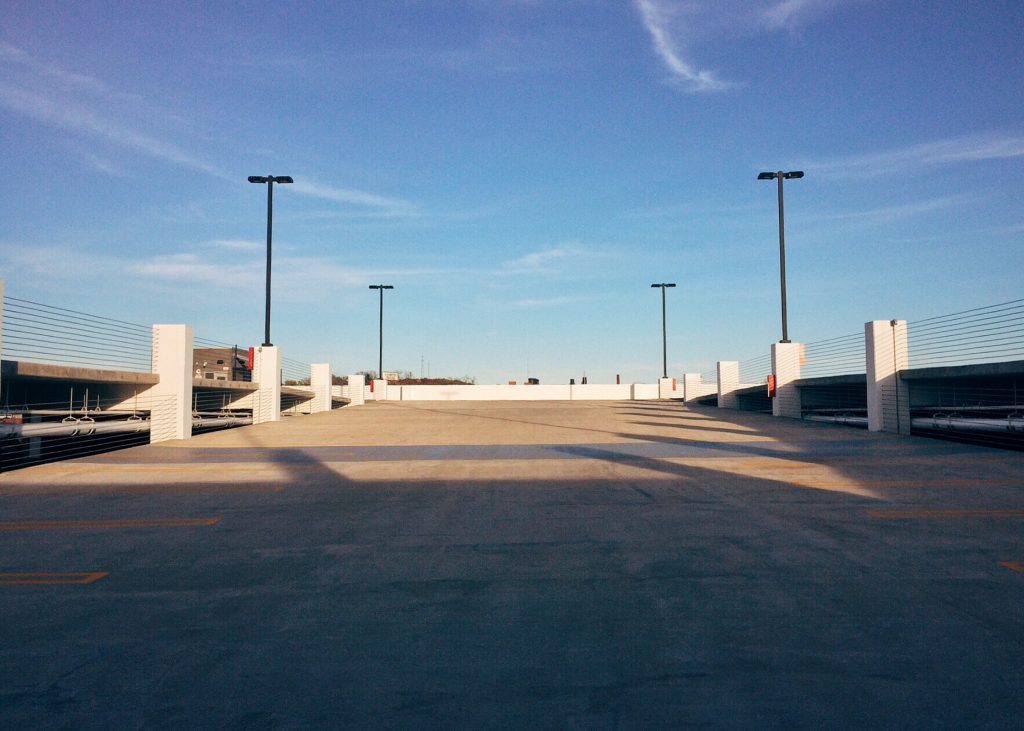
As just one example, the design and construction of parking: While it may not seem significant, a structure can be 20-times the cost of surface lot parking.
Further, some developments might be completely privately funded, while others might be the result of a public/private partnership. If a project will bring regional economic benefits, roads and infrastructure costs might be covered by public funds, which significantly impacts a developer’s budget.
Time is also a significant factor. If project timelines are shorter than what is typical of their park category for any reason, there could be additional costs introduced due to schedule compression – for instance, if design duration is shorter or overlaps with construction, there will need to be more change orders in the field.
Interestingly, there is not a significant cost difference between geographies at this time, which means the Park Experience Index is easily applicable globally.
This is in part because in emerging markets where costs of construction and labor are lower, specialty consultants and services must be imported, or there is higher competition for local resources. In more established markets like North America, higher labor and construction costs are offset by easier access to industry experts.
In this fast-paced industry, stakeholders must also stay on the pulse of ever-changing trends to keep the Park Experience Index and costs accurate.
Prior to COVID-19, the global theme park market was experiencing elevated levels of development activity leading to escalating pressures on pricing from all participants in the project supply chain.
In our forward-looking perspective, with impacts to demand impacts resulting from COVID-19, we do not see these ranges increasing. On the contrary, projects coming onto the design and construction market can expect to leverage significant cost benefits.
In sum, the Park Experience Index is a cost management tool that provides a great starting point and guidelines.
That said, there will always be a need for a specific cost assessment on individual projects to find exactly where they land and determine the warranted investments.
Completing this legwork with a trusted cost management team at the outset will be well worth it and help ensure that a park development project makes it to the finish line.

About the Author
Martin Zurauskas
Managing Director
Martin is the Managing Director for nFusion, where he leads the project management services group with vision and focus into new markets and is responsible for its global efforts. With over 30 years of experience, Martin provides leadership to nFusion’s entertainment and leisure destination project teams, implementing innovative project delivery solutions with the ‘big picture’ in mind, and his finger on the pulse of each project. Full Bio.